Q1Section A (Part A)1 of 120
Data interpretation — largest volume from a density-mass radar chart
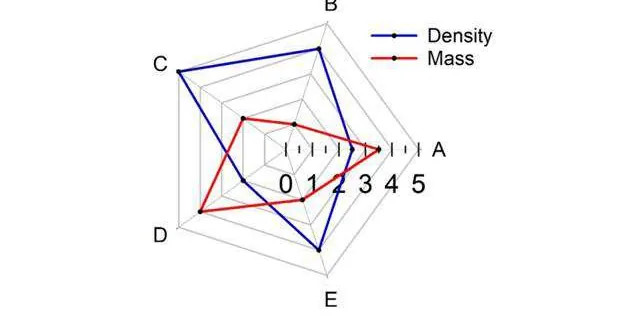
The following figure shows densities and masses of five objects (A to E).
The object with the largest volume is ____.
Pick an option to check your answer.