Q18Section A (Part A)18 of 120
Data interpretation — largest relative change in a bar chart
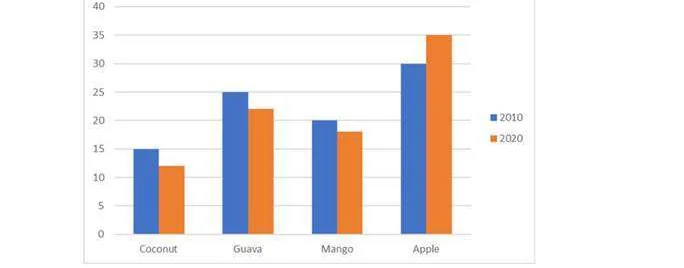
The numbers (in millions) of coconut, guava, mango and apple trees in a region in 2010 and 2020 are shown in the following figure.
The maximum relative change in numbers was for
Pick an option to check your answer.